The Gap Between Busy and Profitable

Your Firm Runs on Billable Hours. Are You Actually Watching Them?

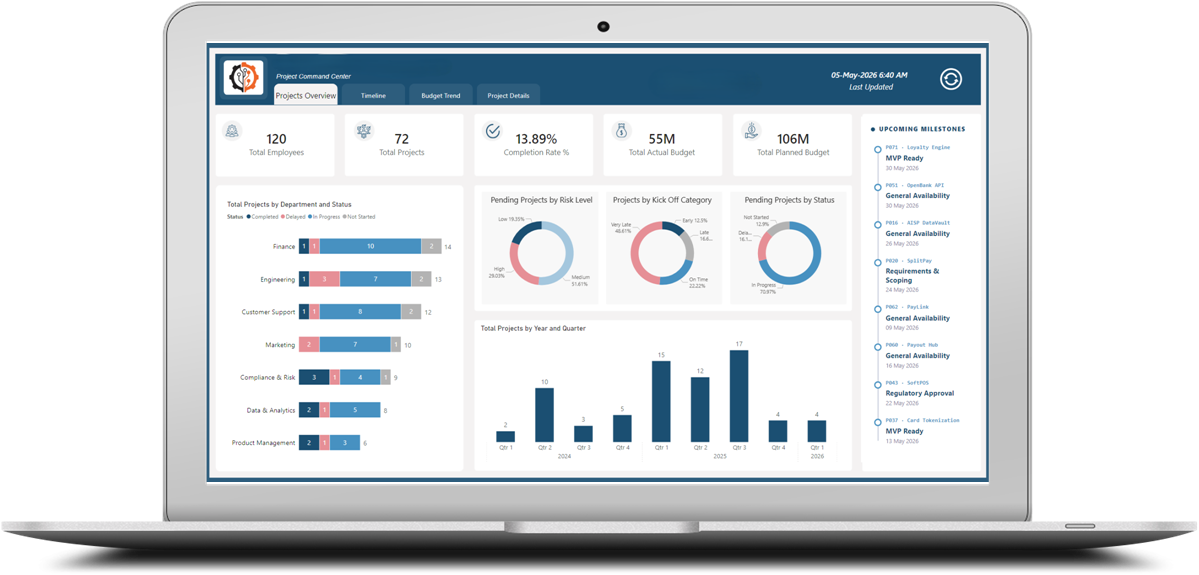
Most professional services firms are managing utilization, project profitability, and pipeline visibility through spreadsheets and gut instinct — and quietly losing money because of it. We build custom Business Intelligence solutions that connect your time tracking, CRM, project management, and accounting into a single, live view of your business. Built for agencies, consultancies, staffing firms, law practices, and accounting firms running 20-500 people.

The Industry Data Is Unambiguous

The Numbers Tell the Story

66.4%

Industry-wide utilization hit a record low in 2025…

down from 68.9% in 2024 and a high of 73.2% in 2021. The industry benchmark considers 75% the minimum healthy threshold — and most firms are falling short of it.

(SPI Research / NetSuite, 2025–2026)
11.3%

Project overrun rate rose again in 2024…

up from 9.6% the year prior. On a $5M project portfolio, that represents roughly $170,000 in preventable cost annually — quietly eroding margins that are already under pressure.

(SPI Research 2025 PS Maturity™ Benchmark)
72%

Of professional services finance leaders…

cite data integration as their single biggest pain point. Reporting, forecasting, and real-time visibility follow immediately behind — all symptoms of the same disconnected data problem.

(Cherry Bekaert CFO Survey, 2025–2026)
The Real Cost of Disconnected Systems

You're Running a People Business. It Would Be Nice to Know What Your People Are Actually Doing.

Professional services is fundamentally simple: sell hours, deliver work, get paid. But somewhere between the time tracker, the project tool, the CRM, and the accounting platform, the full picture gets lost.

Your managing partner doesn't know current utilization until someone pulls the numbers — usually at month end, when it's too late to act. Your CFO can see firm-level revenue, but not whether Client X is actually profitable when fully-loaded labor costs are factored in. Your COO is spending hours each week building reports manually — piecing together data from systems that don't talk to each other.

This isn't a staffing problem or a process problem. It's a data visibility problem — and it has a direct cost. Only 20% of professional services firms hit their profit margin target consistently, despite 57% having a defined target. The difference between those firms and the rest is data infrastructure, not talent.

A 5-point utilization improvement across a 20-person firm generates $200K–$400K in annual revenue — with no additional headcount.
man collecting data
There's A Better Way

Custom Business Intelligence. Built Around the Way Your Firm Actually Works.

We don't sell a generic dashboard tool. We build a custom, end-to-end Business Intelligence solution designed specifically for how professional services firms operate — connected to the systems you already use, surfacing the metrics that actually move your business.

We connect to your existing platforms — QuickBooks, Xero, Harvest, Toggl, HubSpot, Salesforce, FreshBooks, Mavenlink, Wrike, Bullhorn, Clio, and more — and build structured data pipelines that bring everything into a single, clean data warehouse. No ripping and replacing your current stack.

Firms at the highest data maturity level achieve 537% higher profit margins and 739% greater revenue growth than those operating at the lowest level. The primary differentiator is integrated, real-time visibility across delivery, resources, and financials. (SPI Research 2025 PS Maturity™ Benchmark)

Enterprise-Grade Intelligence, Built for the Way Your Firm Operates

1
Connect

We integrate your existing systems: time tracking, CRM, project management, and accounting tools. No system replacement required.

2
Unify

Raw data flows through a structured ETL process into a centralized data warehouse — one clean, reliable source of truth for your entire firm.

3
Visualize

Custom Power BI dashboards surface the KPIs that matter most — utilization, project profitability, WIP aging, pipeline-to-capacity, and team health — updated automatically.

4
Ask

With AI-powered chat, your team queries business data in plain language. "Which clients have we lost money on?" "What's our utilization vs. last year?" No report request. No waiting. Just answers.

Talk to a BI Specialist
The Professional Services Intelligence Suite

Five Dashboards. One Complete Picture of Your Firm.

Utilization Dashboard

Real-time billable vs. available hours by person, team, and practice group. Trend lines, capacity alerts, and comparison to your target utilization rate — updated every morning, not at month-end.

Project Profitability Report

Revenue, labor cost, and margin by project and client. Flags engagements running over budget or below target margin before they become client problems — or firm problems. Firms with real-time budget visibility report 30–40% fewer overruns.

Pipeline-to-Capacity View

Connects your CRM pipeline to your current staffing capacity. Shows available bandwidth if open opportunities close — and flags capacity bottlenecks before commitments are made.

WIP & Billing Health Dashboard

Work-in-progress aging by client and project. Unbilled time approaching billing policy limits. Realization rate trends by billing type. In a 20–50 person firm, WIP can represent hundreds of thousands in uncollected revenue. This is the CFO’s most wanted report — available in real time.

Team Health & Burnout Risk View

Utilization distribution across your team — not just the average, but the variance. When one person runs at 140% while another is at 60%, the average looks fine but a resignation is coming. This view identifies individuals trending toward burnout weeks before it becomes a retention or delivery risk.

Compare

The Firms Pulling Ahead Aren't Working Harder.
They're Seeing Clearer.

Excel / Spreadsheets Full-Time Data Analyst Unified BI Analytics Solution
Mozzart BI
Works with existing systems
Manual exports only
Still requires manual reconciliation
Real-time utilization & profitability data
Reports are stale by the time they're built
Time to value Ongoing manual effort, never automated Months of onboarding, recurring labor cost
IT / technical resources required Low — but staff-intensive to maintain High — full headcount + benefits
AI / Chat interface
Project-level P&L visibility
Possible but not automated or real-time
WIP & billing health tracking Manual, periodic only
Built for professional services Depends on analyst's background
Total cost of ownership Low upfront / high ongoing labor cost High — salary, benefits, turnover risk
Who We Serve

Built for How Your Firm Operates

Marketing & Creative Agencies

You’re already tech-forward and SaaS-comfortable — and acutely aware of how often client work goes over budget and margin disappears. We connect Harvest or Toggl, HubSpot, and QuickBooks into a single operational view so you stop losing margin you don’t know you’re losing.

Staffing & Recruiting Firms

Bill rates, pay rates, spread margin, and headcount on assignment all move at once — and most firms are managing it with Bullhorn and Excel. Real-time margin by client, consultant, and placement type isn’t a luxury in your business. It’s survival.

Accounting & Bookkeeping Practices

You already understand the value of clean data — and you’re serving the same SMB clients we help every day. We build you an operational BI solution for your own firm’s visibility, and can open a referral channel that compounds your revenue over time.

Legal & Consulting Practices

Utilization, WIP aging, and matter-level profitability separate well-run firms from the ones that are busy but not profitable. We connect Clio, your time tracking, and your accounting platform so you have the full picture — every day. 81% of legal professionals already see significant AI potential in their practice.

Explore More

Dig Deeper

See Our Dashboard Examples

See a live demo of Mozzart BI in action, and breakdowns of why that content is effective.

Schedule a demo

Learn About Our Services

Find out exactly how our team will work with you — from data integration and ETL pipelines to custom dashboards & reportsz and AI-powered chat interfaces.

Talk to a BI Specialist

Get Answwers

Checkout our FAQ page to learn more about how we’ve helped professional services firms recover lost margin, surface WIP revenue, and finally move from gut-instinct management to data-driven decisions.

Learn More
Trusted Partners

Our Clients

Your Data Already Knows the Answer. Let’s Help You Hear It.

Most professional services firms have all the data they need to run a better business. It’s just sitting in five different systems with no unified view. We build the connection layer, the warehouse, the dashboards, and the AI-powered insights — custom, fast, and built around how your firm actually operates.

Book a 30-minute discovery call. We’ll map your current data environment and show you exactly what a BI solution built for your firm would look like.

(312) 529-8870