DP365 — Digital Performance 365

Every Channel.
One Dashboard.

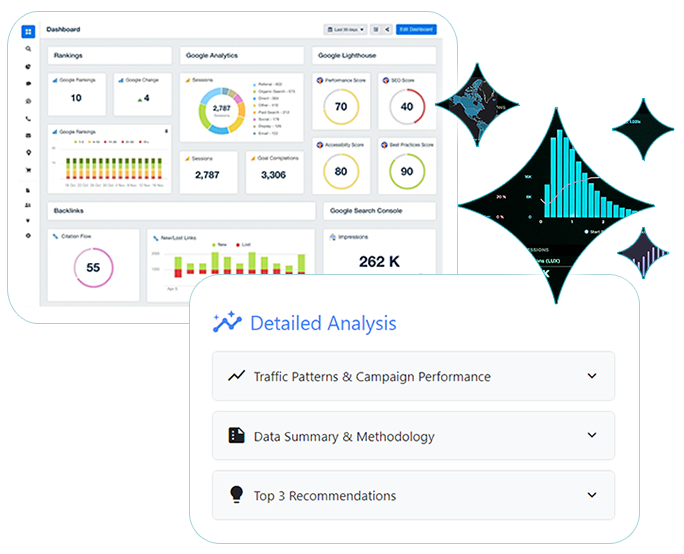
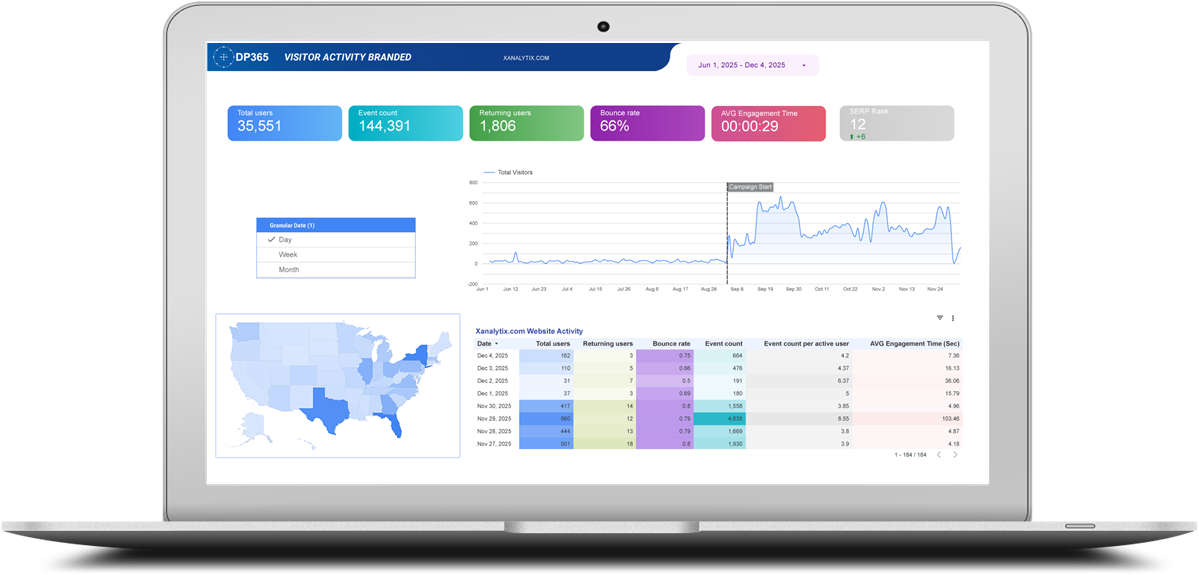
You're spending real money on Google, Meta, LinkedIn, and email — and logging into multiple platforms every morning to piece together a picture that still doesn't add up. DP365 unifies your entire marketing stack into a single, AI-powered command center so you finally know what's working before the budget is gone.

DP365 Marketing Analytics Dashboard
The Fragmentation Problem

Your Marketing Data Exists.
Your Marketing Clarity Doesn't.

5+

Platforms. Zero unified view.

The average SMB marketing manager logs into 5 or more separate platforms every morning — GA4, Google Ads, Meta, HubSpot, and email — each with its own dashboard and its own story. None of them agree.

(Industry average, 2025)
36

Monthly hours lost on manual reports.

Exporting CSVs from five platforms, assembling them in a spreadsheet, and formatting everything manually — only to produce a report that is already stale before it reaches the inbox.

(Medium, 2026)
~0%

SMBs who can connect spend to revenue.

Most SMBs can report their total marketing spend. Almost none can report the revenue or pipeline generated by each channel, campaign, or ad — because the CRM lives separate from the ad platforms.

(McKinsey & HubSpot research, 2024)
Why It Stays Broken

You're Spending Real Money.
But You're Flying Blind.

When a customer clicks a Google Ad, sees a retargeting ad on Instagram, then opens an email and converts — every platform claims 100% credit. The result? Rational budget allocation is impossible.

GA4 defines a “conversion” differently than Google Ads, which differs from HubSpot, which counts every form submission including spam. Without a consistent tracking layer, numbers contradict each other across platforms and every cross-channel comparison is meaningless.

A campaign underperforming for two weeks may not surface until the end-of-month report. By then, the budget is already gone. Real-time visibility changes everything.

The data is there. The unified view is not.
Marketing analytics dashboard showing channel performance
The DP365 Approach

Not a Marketing Tool.
A Business Management Tool for People Who Spend Money on Marketing.

We don't replace your existing platforms. We build a unified intelligence layer on top of them — connecting your data at the source, standardizing it through a structured pipeline, and surfacing it in dashboards, reports, and AI-powered tools your team will actually use.

“The single source of truth for every dollar you spend on marketing — across every channel, every campaign, every vendor.”

Four steps from fragmented data to complete clarity:

1
Connect

We connect directly to Google Ads, Meta, GA4, HubSpot, Mailchimp, LinkedIn, and more. No manual exports. No CSV uploads. Live data from every channel in a single pipeline.

2
Unify

Raw data flows through a structured ETL process into a centralized data warehouse — one clean, consistent source of truth where conversion definitions actually match across platforms.

3
Visualize

Custom dashboards surface total spend, total leads, CPL, and ROAS across all channels in one view. Updated daily. The single screen that replaces multiple platform logins.

4
Ask

With AI-powered chat, your team can query your marketing data in plain English. “What was our best campaign last quarter by cost per lead?” — answered in seconds. No SQL. No waiting on a report.

Explore the Full Feature Set
For SMB Owners & CFOs

"Finally know if your marketing spend is actually working."

Marketing is often the second or third largest operating expense in an SMB. It deserves the same accountability as every other line item — not a gut feeling and a monthly PDF from your agency.

$15K
avg monthly spend with no ROI visibility
23x
more likely to acquire customers with BI
30d
typical time to full deployment
Get a Free BI Analytics Audit
Marketing Command Center

Six Fully-Customized Dashboards.
Launchable in Under 30 Days.

The DP365 Marketing Command Center is an engineered set of dashboards and AI tools built around your top integrations — live within weeks, not months.

Unified Campaign Dashboard

Total spend, total leads, CPL, and ROAS across all channels in one view. Updated daily. The one screen that replaces five platform logins.

Attribution & Channel Mix

Cross-channel attribution showing each platform's actual contribution to conversions. Side-by-side CPL and ROAS comparison with trend lines by channel.

Marketing-to-Revenue Bridge

Connects ad platform spend directly to HubSpot pipeline stages and closed revenue. Shows cost per MQL, SQL, and closed deal by channel and campaign.

Email Performance Overview

Open rate, click rate, conversion rate, and revenue attributed to email campaigns. Trend analysis and list health metrics alongside send performance.

SEO & Organic Search View

Google Search Console keyword data alongside GA4 organic traffic. Paid vs. organic comparison, branded vs. non-branded search split, and ranking trends.

Budget Pacing & Alerts

Daily spend vs. budget by channel with projected monthly totals. Automated alerts when CPL, CPC, or spend pacing moves outside defined thresholds.

Platform Connections

Does It Connect to My Stack?
Yes. Here's What We Support.

Integration coverage is the primary purchase criterion. Marketers always ask “does it connect to X?” first. Here's the answer.

Tier 1 — Standard Connectors

Present in 9 out of 10 SMB marketing stack.

GA4 Google Analytics 4
Google Ads Google Ads
Meta Meta Ads Manager
HubSpot HubSpot CRM
Mailchimp Mailchimp
Tier 2 — High-Value Connectors

Present in more sophisticated stacks. Each unlocks a distinct, high-value use case.

Search Console Google Search Console
LinkedIn LinkedIn Ads
SEMrush SEMrush / Ahrefs
Klaviyo Klaviyo
ActiveCampaign ActiveCampaign
Tier 3 — Emerging & Niche
TikTok TikTok Ads
Google Business Google Business Profile
Shopify
Yelp

We connect your entire marketing stack

Compare

The Marketers Pulling Ahead
Aren't Working Harder. They're Seeing Clearer.

Spreadsheets &
Disconnected Dashboards
Agency Monthly
PDF Reports
DP365 Marketing
Command Center
Recommended
Unified cross-channel view
Manual assembly only
Agency-curated snapshot
Real-time data Monthly, not real-time
Cross-channel attribution
Each agency claims full credit
Connected to CRM / revenue
AI / conversational interface
Automated alerts
Independent from your agency Partially
Agency controls the data
Time to value Ongoing manual effort Next monthly cycle
Monthly reporting burden 4–8 hours / week Still requires review & follow-up
Conversational AI

"Ask your campaigns a question.
Get an answer in seconds."

Marketing questions are naturally ad-hoc. A manager who can ask "What was our best-performing campaign last quarter by cost per lead?" and get an instant answer isn't using a better dashboard — they're experiencing a genuinely new capability.

No SQL. No waiting on a report. No scheduling a meeting with your analyst. Just your business data, answering your questions in plain English.

Book a AI Demo
DP365 Marketing Command Center — AI Chat
JM
What was my best-performing campaign last quarter by cost per lead?
Your top campaign last quarter was Google Search — Brand Keywords.
$14.32 Cost per lead
That's 38% lower than your next best channel (Meta Retargeting at $23.10). It also drove 47% of your total MQLs on 22% of your budget.
JM
How did our email click rate trend over the past 90 days?
Your average email click rate over 90 days was 3.4% — up from 2.8% the prior period (+21%). Your highest-performing send was the Q4 Product Update at 5.9% CTR on October 14th.
Agency Partner Program

Marketing Agencies: Agencies managing SMB campaigns can embed DP365 as their own branded client reporting infrastructure.

White-Label Reporting

Co-branded dashboards with your agency's logo and color palette. Your clients see your brand, backed by enterprise-grade analytics.

Multi-Client Dashboard

Manage all your SMB clients from a single agency view. Monitor performance, flag issues, and generate reports across your entire book in one place.

Revenue Share

A 15–25% revenue share arrangement makes adoption financially attractive. Each new client you onboard adds a recurring revenue stream for your agency.

Accountability as Differentiator

Agencies that provide clients with live, independent dashboards signal confidence in their own work. Transparency becomes your competitive advantage, not a liability.

A dedicated agency dashboard for managing multiple client accounts simultaneously. Reduce internal labor costs while elevating every client relationship.
Trusted Partners

Our Clients

Your Data Has a Story to Tell.

Which channel is pulling its weight. Which campaign is quietly draining budget. Which customer came back because of an email you almost didn't send. The signals are all there — they've been there — but disconnected platforms and fragmented data have been drowning them out. DP365 clears the noise. Start with a free Marketing Data Audit — and hear what your marketing has been trying to say.

(312) 529-8870